Empower Your Sales with Our CRM

About this template
Pipeline
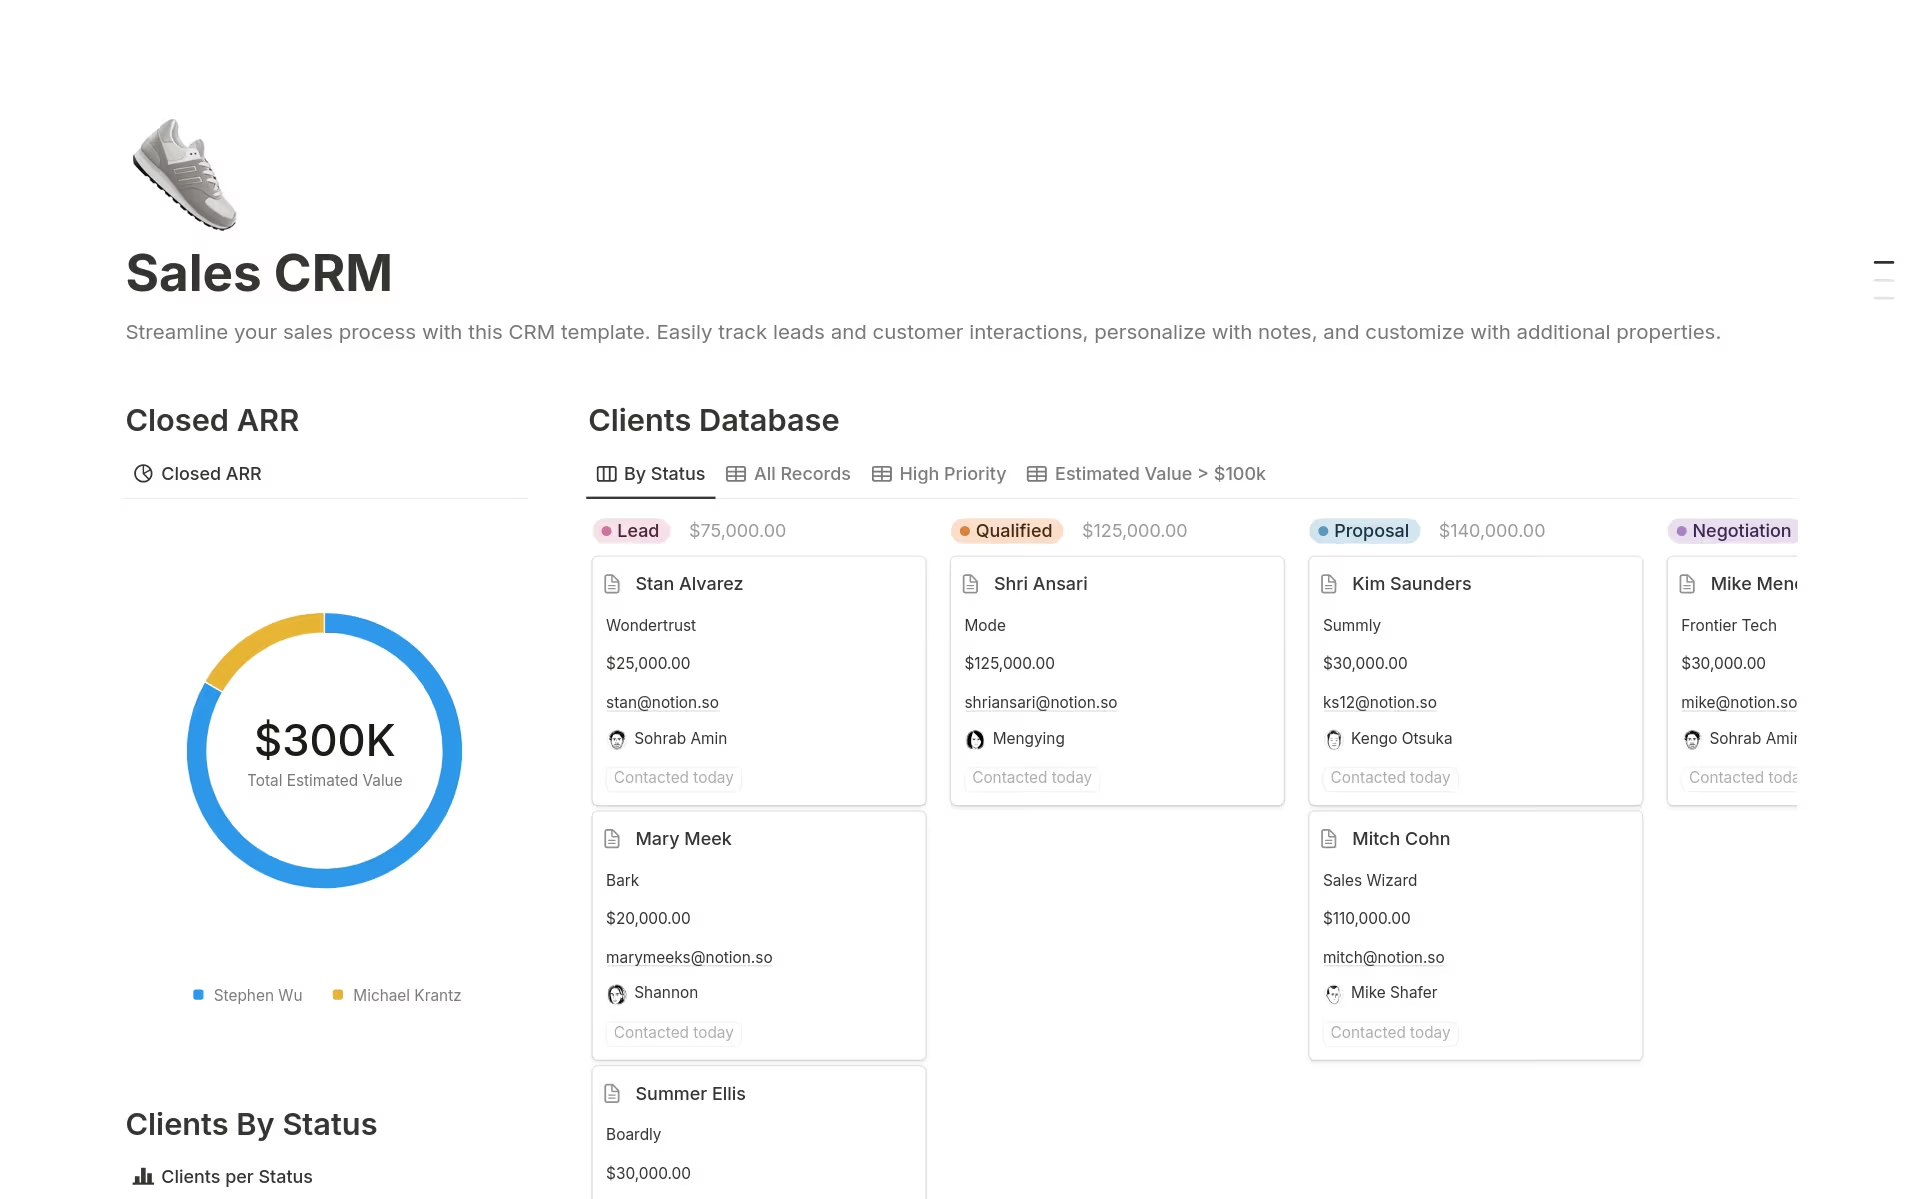
Description: The most crucial part of the template. The Pipeline helps you visually manage the sales process from the first contact with a potential customer to the closing of the sale. To make this possible, it is necessary to have critical properties that allow the best possible management without losing ease of use. Let's start with the basics, with properties such as:
Description: Specific details about the opportunity or project.
Client: Name of the company or person.
Main Contact: Main contact person at the client.
Phone: Phone number of the main contact.
Email: Email address of the main contact.
Project Creation Date: When the opportunity was created.
Seller: Person on your team responsible for the opportunity.
These properties are essential, and therefore, we seek to optimize the filling of fields by connecting our Pipeline base with the customer base. Simply select the customer name and the other fields will be filled in automatically, a very simple but useful process.
Pipeline Stage
Select the phase in which our project is located:
New
Qualified
Initial Contact
Proposal Sent
Negotiation
Won
Lost
In particular, this property is essential to know what percentage of sales closing a project has at any time. By assigning probabilities to each phase of the Pipeline, you can obtain a clear and quantifiable vision of the probability of success of each opportunity. This not only helps you prioritize your efforts on the opportunities with the highest probability of closing, but also provides you with a more accurate estimate of your future income. In addition, it allows your sales team to focus their strategies more effectively, based on concrete data.
Last Interaction
This formula property will show us a counter with the number of days that have elapsed since the last interaction we had within the project. How does it work?
The formula will calculate the days between the date of the last update and today. For example, if the last update was on May 27 and today is May 30, and there has been no change in the project tracking, it will tell us that 3 days have passed without any project tracking.
Benefits:
Active Monitoring: Helps you maintain constant and active monitoring of each opportunity, ensuring that none go unattended for too long.
Task Prioritization: Quickly identify projects that need immediate action, prioritizing those with the longest time without interaction.
Relationship Improvement: By reducing periods without contact, you improve the relationship with your customers, showing constant and attentive commitment.
This property is essential to ensure that all opportunities receive the proper follow-up.
Status
Another of my favorite tracking properties is Status. This property is a very simple but effective formula that helps you know if a project is on time or behind its expected closing date.
How it works:
Expected Closing Date: When assigning a closing date in the Expected Closing property, the formula calculates the project status based on that date.
Status Indicators: The formula displays a colored circle indicating the project status:
Green: The project is on time and within the estimated closing range.
Yellow: Today is the estimated closing date for the project.
Red: The project is behind schedule.
Services
The Services property is a relationship with the services database. It works simply: we select an element within our services database and it will return the name and description of it.
Potential Value
The Potential Value property is crucial for estimating the financial value of each project.
How it works:
Value Assignment: Assign the potential value of the project in this property. This value represents how much the project could be worth if it is successfully closed.
Kanban View: Within your Kanban board, you can see the total potential value of the projects that are in the same Pipeline Stage.
Task
The Task property is a relationship with the task database, designed to display and manage the tasks assigned to each project. This property creates a connection between the project and the specific tasks assigned to it. It displays a counter that indicates the number of pending tasks versus the total number of tasks assigned to the project, based on their status.
Dashboard
Now, let's move on to the best of all... our Dashboard. In Mussi we share the famous slogan and philosophy of Notion: "software should be beautiful". We wanted to reflect this idea on the main page or Dashboard of our CRM template.
Navigation: In this section, you will find quick access to each part of the Dashboard.
Buttons: Just below the navigation, you will have buttons to register a new customer, create a project, a task or schedule a meeting.


