In lean management and project management, dozens of tools aim to optimize product creation. And they can be hard to filter through.
But what if one tool could visualize your workflow and let you use your other tools more effectively, all while centering the true value of your product? That’s where value stream mapping (VSM) comes in.
When it comes to making a product, your process is all about the customer, and that goal gets lost if you don’t keep it at the forefront of what you do. VSM exists to remind you that what you create serves a purpose, making sure your procedure maintains that value from start to finish.
And the best thing about VSM — aside from optimizing your product value to customers — is that it's a totally visual process. All you need is a whiteboard and time.
What’s value stream mapping?
VSM is a lean management method that physically maps out your workflow to help you eliminate wasteful processes. Once you draw out your VSM, you'll be able to see where to adjust and optimize your practices, letting you create the best procedures possible.
VSM is one of many techniques originating from Toyota's lean manufacturing methods, like Six Sigma and Lean Six Sigma. But unlike other lean concepts, VSM is a bit more literal because it’s an actual on-page process.
To really understand VSM, you need to talk about the V: value. Value is the worth of your product or service — anything your customers would be interested in paying for, consciously or subconsciously. They know they’re paying for a finished product, but they’re also paying for the quality assurance checks that make that product great. Your VSM will visualize both of these processes (and then some) to meet customer expectations and create a high-value end product.

The 5 elements of a value stream map
Like flowcharts, VSMs use value stream map symbols to represent different stages and steps in your workflow — think a triangle for inventory and an arrow for shipment. These symbols map out five fundamental areas, each of which will give stakeholders and your process improvement team a crystal clear view of the elements that make up your workflow.
Information flow — at the top level of your VSM, information flow explains your product’s journey, usually from supplier to production to customer.
Product flow — this section shows how your product becomes something out of nothing. It’ll include references to each overall step in the process (generally departmentalized) and how your product moves from one cycle to the next.
Time ladder — below your product flow, a time ladder illustrates a stripped-down version of your value stream timeline. It will visually toggle between the time it takes to complete each step of the process and the time between the processes themselves.
Customers (or clients) — your audience should be the first element you add to your VSM visualization, because they’re the ones you’re creating value for. This element will include customer requirements and data that informs takt time (explained below).
Suppliers — the final piece of the puzzle, the supplier section, should be relatively simple. Group suppliers together by stage, offering, or location. Not every supplier has to appear on your VSM — the point is to log that they exist and at what stage.
Value stream mapping terminology
When adding VSM elements to your visualization, you'll run into some terminology that defines and disseminates your process flow. Clearly labeling the points in your VSM with these terms helps identify and quantity each one, eliminating waste and offering a clearer map.
Takt time
That's not a misspelling. Takt time is a metric that sets the pace for your product creation process so it matches customer demand. If you sell 100 paper clips every 10 minutes, you'll want to adjust your production to meet that demand. While this is a manufacturing term, takt time still applies to any industry serving customers a product or service.
Lead time
This metric represents the average amount of time needed for one feature request to travel from conception to completion. Maybe it takes 30 days to design and then deliver a larger paper clip to customers — that’s lead time.
Cycle time (C/T)
The cycle time is the average amount of time between delivering the large paper clip to starting to work on a new, massive paper clip. Basically, it's the time between completing one project and starting the next.
Setup time (S/T)
This is the time it takes to fully procure the resources and information you need to start any step in the process. Researching paper clip sizes might take a few days, or sourcing metal for manufacturing could take a week. In development terms, this could be the time it takes to install a new server or reserve space in a development environment.
Uptime (%)
Uptime represents the percentage of time the processes are active relative to working hours. It could refer to how much time out of the day the development team has access to test servers or how much time you allocate to bending paper clips.
Kaizen burst
One of the most vital value stream mapping tools is the Kaizen burst or blitz, which on your map looks like a cartoon explosion. You’ll add this element when your team needs to finish something fast, usually within a few days. Most teams use it to return to a steady work queue or remove project-stopping bottlenecks.

Value stream mapping pros and cons
As with anything related to lean management, VSM comes with downsides. It does streamline your workflow, but creating a visual takes time and energy you might not have. Here’s how to weigh the pros and cons:
VSM benefits
Visually mapping your workflows helps your team identify and eliminate waste, because you can actually see where it is. Errors and bottlenecks move out of the abstract and into the physical, making them much easier to understand. And once you identify those wasteful areas, your team can work to improve their process flows and collaboration methods. You’ll embrace efficiency and bring higher value to customers, faster.
VSM challenges
The main challenge with VSM is that you might overdo it. With anything else in Lean management, you can get so preoccupied with optimizing and creating a perfect VSM model that it becomes a wasteful activity in itself. Be sure to balance the level of effort put into your VSM with what you’ll actually get out of it.
Creating a VSM visual also might involve stakeholders and experts from different areas of your business, which can lead to tricky scheduling and knowledge overflow. You can temper this complexity by only including a single source of information from each department — usually a subject matter expert with the most product knowledge.
Avoid these problems by starting small. Sketch out your VSM first on a whiteboard or piece of paper before getting into the dedicated symbology, and decide who you actually need to involve. This will help everyone become comfortable with the process and gauge how deep they want to go before diving in.
Value stream mapping use cases
Companies large and small use VSM across industries. It may have started in manufacturing, but now everyone has a product vision board with VSMs and other flowcharts that visualize processes. Here’s how different types of teams use this tool:
Manufacturing — the most obvious application, manufacturing teams use VSM as part of the lean manufacturing process to eliminate wasteful steps on the production line and improve outputs.
Healthcare — the healthcare industry implements VSM to increase cost-effectiveness while identifying costly bottlenecks, from when a patient arrives in the waiting room until they leave.
Software engineering — VSM helps software teams reduce wait times, eliminate feedback loops, and root out inefficiencies in development processes.
Supply chain and logistics — enterprises utilize VSM to visualize a birds-eye view of their supply routes, uncovering any time-wasting processes like duplicate delivery schedules.
Finance — firms map out different value streams to visualize their internal cost allocations. VSM also helps reveal redundant tasks and opportunities for automation.
Workplaces — pretty much any office or online workspace can benefit from VSM. You can eliminate wasteful procedures and increase productivity by analyzing workflows and inefficiencies, from communication between departments to office supplies.
How to create a value stream map
Creating a value stream map is less of a rigid set of instructions and more of a general process to follow. You can personalize your map to your company or project, as long as you remember its purpose: to reduce waste and derive more value.
Define the problem — from the customer's perspective, determine the process your company needs to improve. Is it new product features? Improving speed in your mobile app? Write down the issue and share it with your team.
Pick the right team — speaking of teams, pick the right stakeholders to work on and discuss your VSM. Find experts in the areas your problem process touches.
Map your process — start by focusing on potential issues, then expand your VSM to other functions. Don't burden your team with every little piece of information when you don’t yet know what you need.
Add process data — under each process, list the process data. This is where the cycle time, uptime, and other VSM terms appear.
Create a timeline — map out a timeline for each process, including your lead times.
Analyze your map — gather all your stakeholders together and schedule a meeting to bring everyone to the same page. Break down every step of the process and ask plenty of questions. Gather feedback and eliminate the process steps the team agrees bring no value to customers.
Design your new map — armed with your feedback and notes, design a new VSM that eliminates wasteful processes.
Implement your VSM — implementing your new map sounds easy, but you'll need buy-in from the product team if you haven’t included them in the process. Add some KPIs to measure progress and make sure the new workflow is doing what it’s supposed to. Adjust your VSM as necessary.
Improve your company's processes with Notion
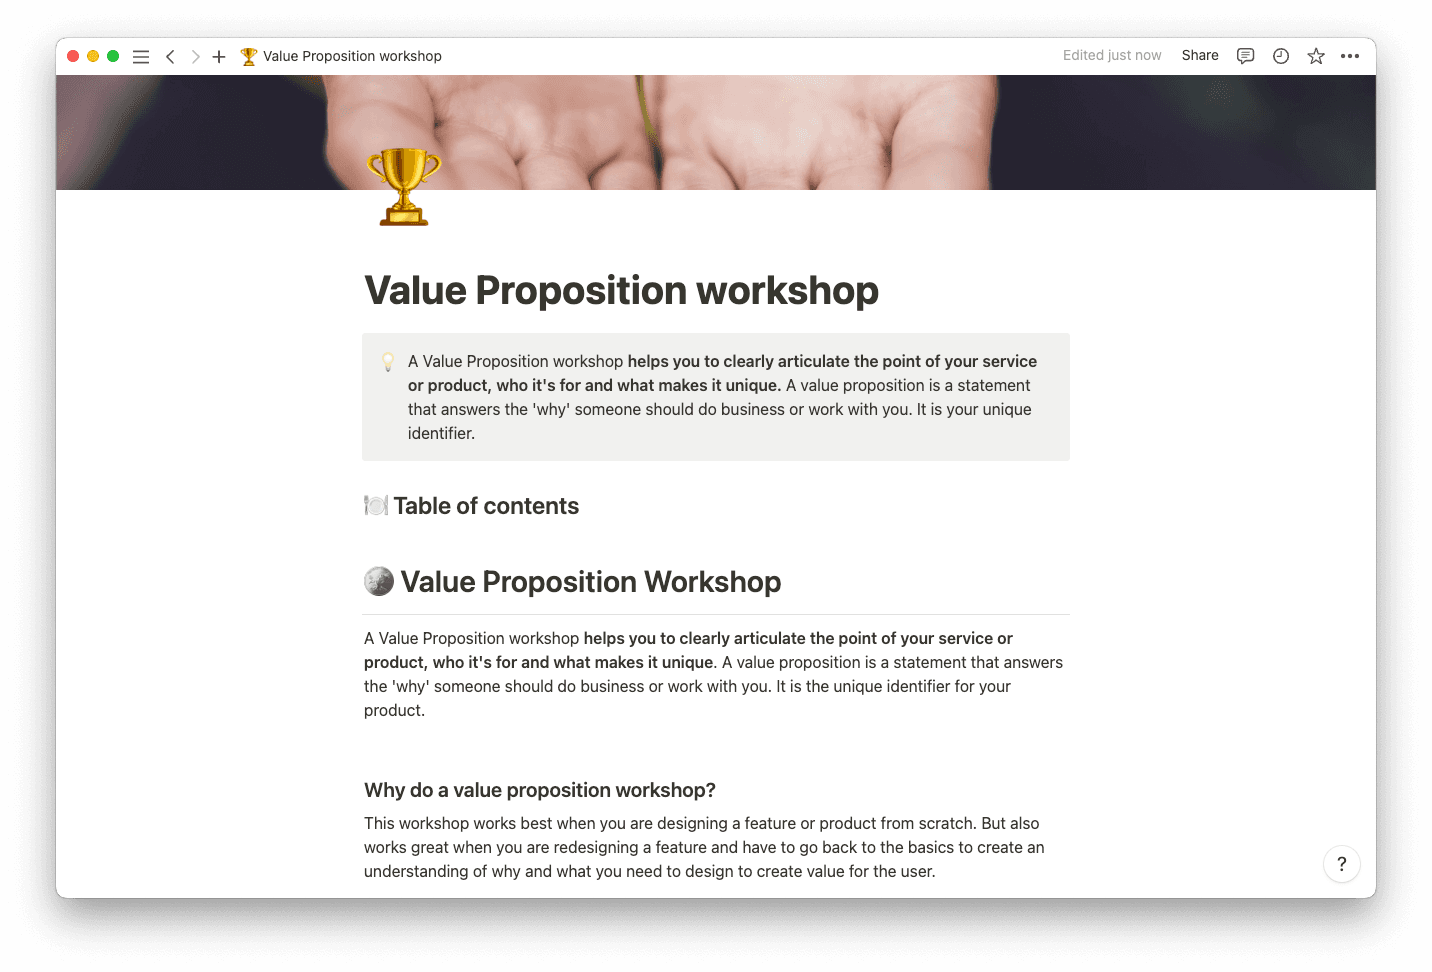
You need time-saving, efficiency-creating, and value-adding templates to organize your teams and implement VSM. Start with Notion's value proposition workshop template to clearly define your goals, then create a product wiki to turn those goals into reality. Product release notes and roadmap templates will help you get there, too. Do it all in Notion.


